Network Management System & Metrics
Unified, Single-Pane-of-Glass Network Performance Management
Stop guessing. Monitor interface metrics, track hardware health, and automate network discovery across your entire multi-vendor infrastructure using a powerful open-source foundation.
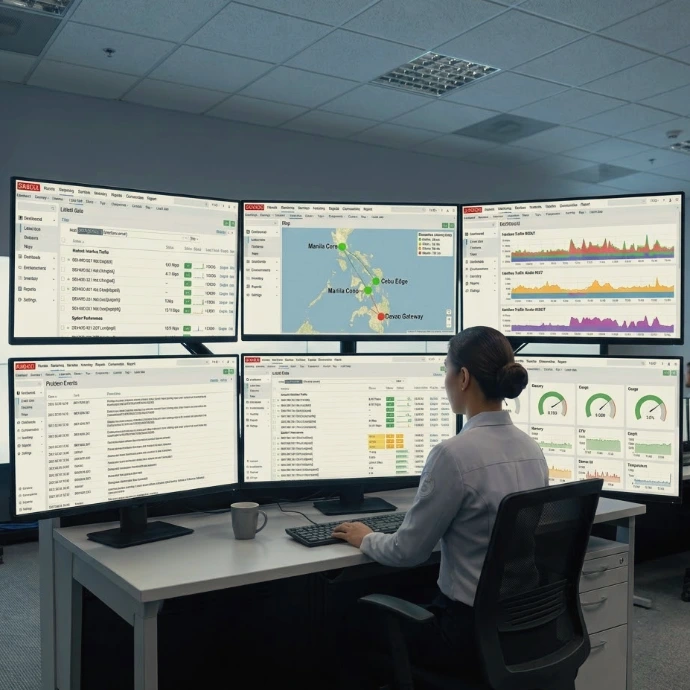
Real-Time Performance & Metrics Tracking
Interface Traffic Observability: Real-time tracking of Ingress/Egress bandwidth utilization, interface speeds, and duplex configurations.
Link Quality & Health Monitoring: Immediate detection of interface errors, dropped packets, discards, and link flaps before they impact users.
Device Environmental Status: Continuous polling of chassis temperatures, fan speeds, and Power Supply Unit (PSU) redundancy status.
Core Hardware Utilization: Granular tracking of CPU loads, memory consumption, and system uptime across all network nodes.
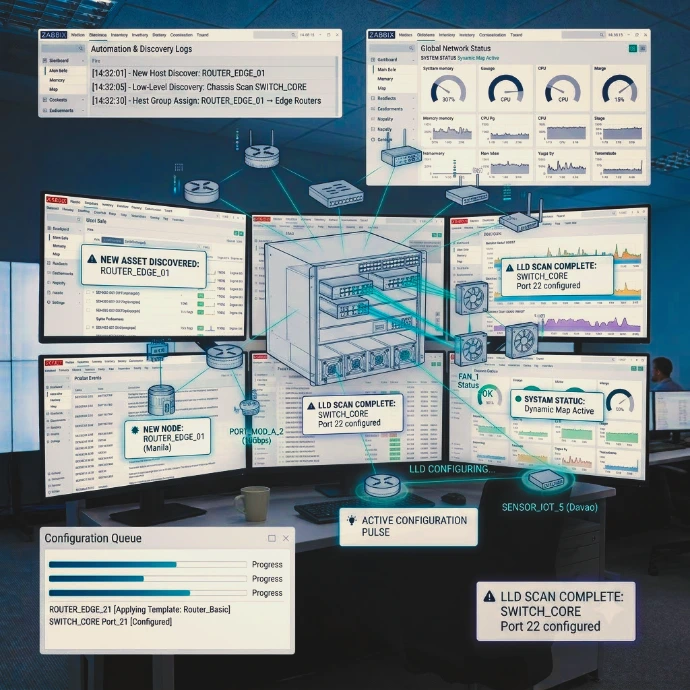
Automation & Dynamic Asset Onboarding
Network Range Scanning: Automatically sweeps designated IP ranges to identify new devices by open ports or responsive protocols.
Low-Level Discovery (LLD): The system doesn’t just find a switch; it dynamically discovers its internal components—instantly mapping out every port, fan module, and sensor without human intervention.
Instant Policy Application: Automatically categorizes newly discovered assets into specific host groups and applies corresponding monitoring templates instantly based on vendor type.
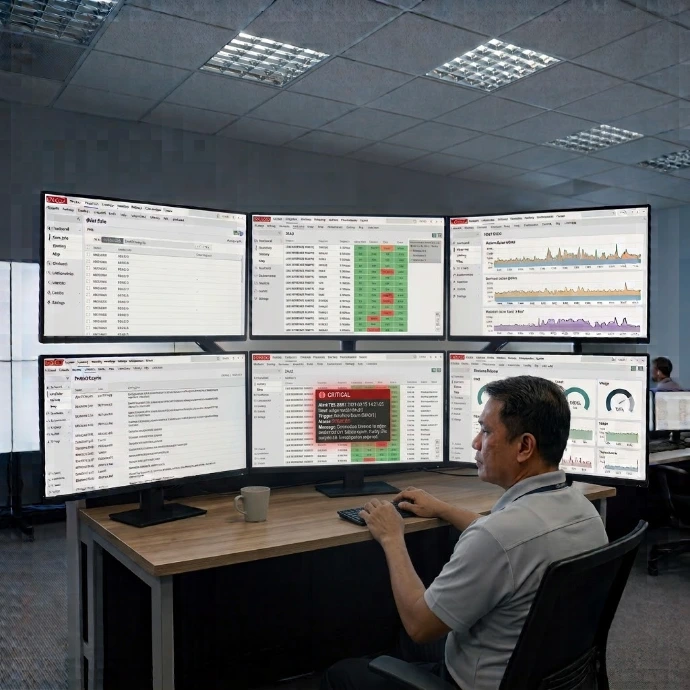
Intelligent Alerting & Event Remediation
Automated Self-Healing Actions: Executes immediate edge remediation scripts (such as automatically cycling a flapping switch port or restarting a hung service) the moment a trigger fires.